

| Programming 3D Lissajous graphics |
 | back to Lissajous page |
 | download Delphi-7 project |
 | view source code |
| load dav7components |
This article describes Delphi program Lissajous3D which generates computer art
by using 3 dimensional Lissajous graphics.
About 3-D
A computer screen has 2 dimensions, so to paint 3 dimensions, a trick must be used.Below a cube is pictured in 3 dimensions, where so called parallel projection is used.
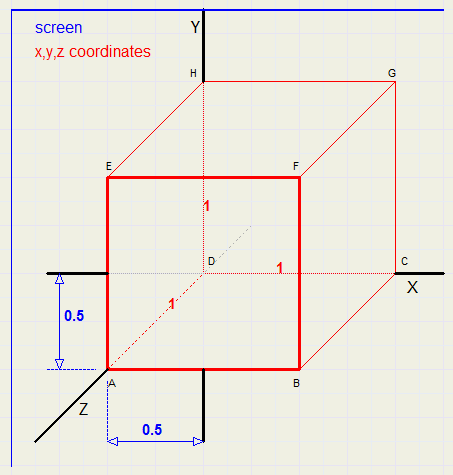
the 2 dimensional screen coordinates are painted in blue.
3 Dimensional coordinates are denoted by (x,y,z), the x,y,z axis are perpendicular.
Assume AB = AD = 1.
Points A and D both have X coordinate 0.
The Z coordinate of A is 1.
So, A is shifted somewhat to the left to show the Z value.
Also, A has a Y coordinate of 0.
But Y is shifted down somewhat to show the Z value of 1.
In the picture we notice that a Z value of 1 causes X to shift left by 0.5
and Y to shift down by 0.5
Writing 3-dimensional coordinates as (x,y,z) and 2-dimensinal screen coordinates as [px,py], we see:
-
[px,py] = [x-z/2, y+z/2] = (x,y,z)
In the picture above, AB,BF .. are shown in their real dimensions,
but BC,EH.. are shown shorter.
Their size of 1 is pictured with a length of root(0.5^2 + 0.5^2) = 0.707
3-D in general
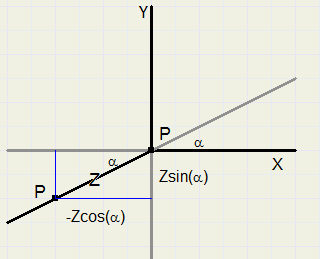
To a 2 dimensional (x,y) coordinate system, we add a Z axis under angle a with the X axis.A point P has (x,y,z) coordinates.
In the picture below, we notice that a Z value causes shifting of (x,y)
-
x becomes x - Zcos(a)
y becomes y + Zsin(a)
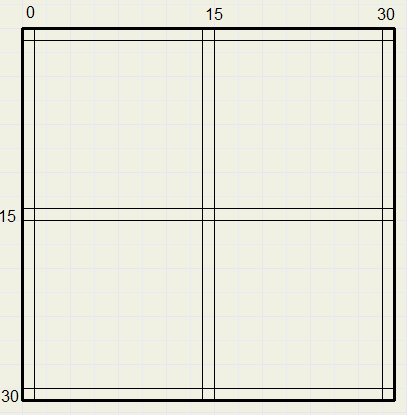
The Screen
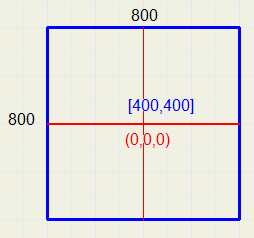
Screen size is 400 * 400 pixels.
(0,0,0) = [400,400].
Screen center value is set to [385,385] becauze the pen size is 31*31 pixels, point (0,0) being the left top.
Therefore, the center of the pen is at [400,400] at position (0,0,0).
The value of a sine or cosine function varies from -1 ...1.
In this program, a scale is used of 250 : 1, 250 adjacent pixels have a length of 1.
The Z value, being als -1.. 1 may add values -0.5 .. 0.5 to X and Y.
So, the maximum pixel distance from point (0,0,0) is 250 + 125 = 375 pixels.
The center is at screen position [400,400].
The functions therefore have the form:
-
x = 250cos(..t)
y = 250sin(..t)
z = 125sin(..t)
Depth
Look at the picture below: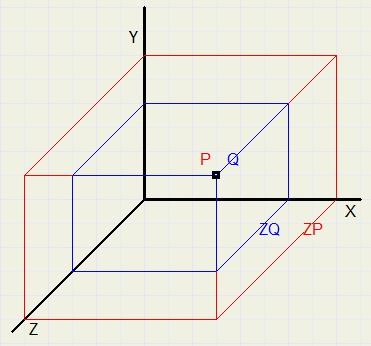
Therefore, Q may not overwrite P.
This is accomplished by assigning a Z value to each pixel, indicating the highest Z value written.
Printing of a pixel having a lower Z value is prohibited.
Data formats
type Tpixels = array[0..30,0..30] of dword;
     TZ = array[0..30,0..30] of smallInt;

var Zbuffer : array[0..799,0..799] of smallInt;  //Z value per screen pixel
    SPixels : TPixels;                           //pen pixels
    SZ : TZ;                                     //pen Z value
Painting is done in a bitmap of 800 * 800 pixels.Reason is much faster (direct memory) access.
The bitmap is copied to a paintbox on the form to become visible.
Clearing the screen
Each pixel is set to the white color $ffffff and each Z value is set to -400.So, every point having a higher Z value than -400 may write this pixel.
Transparent pixels of the pen are set to -1000, prohibiting the painting.
There are four pentypes: sphere, cube, rectangle and circle.
The sphere and cube pens are 3 dimensional by themselves.
Making the "sphere" pen
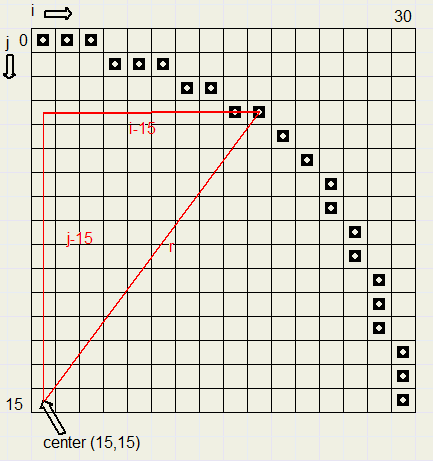
Making a good circle
The equation of a circle with radius r and center (0,0) is x2 + y2 = r2The pen is stored in a [0..30,0..30] array of dword:
We enlarge a quarter of the pen image to show how this is done:
-
(i-15)2 + (j-15)2 <= 225
This is fixed by changing the test to
-
(i-15)2 + (j-15)2 <= 229
The depth
The equation of a sphere with radius r and center at (0,0,0) is x2 + y2 + z2 = r2Therefore knowing x and y (or i and j), z is given by
-
z = root(r2 - x2 - y2)
A pixel with depth >=0 belongs to the circle.
making the color
A good sphere can be drawn by selecting the lightest spot somewhere in the left topand the darkest spot at the right bottom.
Then each pixel is assigned a color proportional to it's distance to the light point.
The dark color is assumed black (0).
The light spot is at (10,10), the dark spot at the right bottom (26,26) of the sphere.
So, over a distance of 23 pixels, 23 being the root of (2*(26-10)^2), the color loses 100% of it's intensity.
This is about 4% per pixel distance.
Distance of (i,j) to light spot (10,10) is given by root((i-10)2 + (j-10)2).
At a pixel distance of n from the light spot, the color must be multiplied by d=(1 - n*0.04)
The (light) color is unpacked to it's red, green and blue components.(vr,vg,vb in the source code)
Part of the source code is listed below
  for j := 0 to 30 do
   for i := 0 to 30 do
    begin
     d := 229 - sqr(j-15) - sqr(i-15);
     if d >= 0 then
      begin
       SZ[i,j] := trunc(0.5*sqrt(d)+0.5);
       if (abs(i) < 4) and (abs(j) < 4) then d := 1
        else d := 1 - sqrt(sqr(i-10) + sqr(j-10)+0.5)*0.04;
       r := trunc(vr*d);
       g := trunc(vg*d);
       b := trunc(vb*d);
       Spixels[i,j] := r + (g shl 8) + (b shl 16);
      end;
    end;
See the source listing for all details.Drawing the pen
This amounts to:- adding the z values of the pen position and the pen's pixel
- copying the pixel to the bitmap if this value is greater then the screen's Z value.
Direct access to memory is used.
po points to the left-top pixel of the bitmap.
pstep is the pointer difference between two rows.
These values are set at initialization.
Drawing the picture
Stepcount is the amount of t values.t runs from 0 to Stepcount.
There are 2 modes: not smooth and smooth.
In the first mode, simply an image of the pen is written for each value of t.
In the second mode, also the intermediate pixels are written.
Say t advances somewhere in the process from x=10 to x=15.
In not smooth mode, the pen image is painted twice.
In smooth mode, the pen is written at x=10,11,12,13,14,15.
For y and z, interpolation is used.
If the y step is larger then the x step, say y advances from 20 to 30,
then the pen is pictured for y=10,..,30 and interpolation for x and z is used.
See the source listing for details.
Load and Save
The settings for a particular graph may be saved and reloaded.An array[0..15] of dwords is used with the format:
   |--------|--------|--------|-------l|
   |--------|--------|--------|-------i|
   |--------|--------|--------|-------s|
   |--------|--------|--------|-------s|
   |--------|--------|--------|-------a|
   |--------|--------|--------|-formula|
   |--------|--------|--------|-----pen|
   |--------|--------|--------|---color|
   |--------|--------|--------|--smooth|
   |--------|--------|--------|----grid|
   |--------|--------|--------stepcount|
   |--------|--------|--------increment|
   |-------- --------A-------- --------|
   |-------- --------B-------- --------|
   |-------- --------C-------- --------|
   |-------- --------D-------- --------|
formula: 1..4
pen : 1..4
color : 0..6
smooth : 1 = true 0 = false
grid : 1 = true 0 = false
stepcount : 100..1000
increment : 1..13
About the Delphi project
The project consists of form1,unit1 with the user interface and unit2 with the typical 3D painting procedures.Unit2 stands on it's own and does not use unit1.
To make a 3D graph the following must be done:
-
- call procedure makepen(pNr:byte; col:dword); //make pen image 1..4 with color col
- call procedure setstepcount(sc : word); //set the step count
- call procedure setsmooth(sm : boolean); //to set/clear smooth mode
- call procedure setconstants(a,b,c,d : single); //to set constants a,b,c,d
- call procedure makedrawing(formula : byte); //to make graph using the formula 1..4
This procedure is called by the user interface to show the pen images.
This concludes the 3D drawing description.

