

| Graphics Explorer Version 3 |
| download version 3.1 | download version 3.0 |
Version 3.1
- interim variable v for parametric functions is placed next to the coordinate system.
Version 3.0
- coordinate system of 800 x 800 pixels
- superscript formula editing (not x^2 but x2)
- formulas saved in .gxl file, together with color and settings
To see the (Delphi project) source code, look [ HERE ]
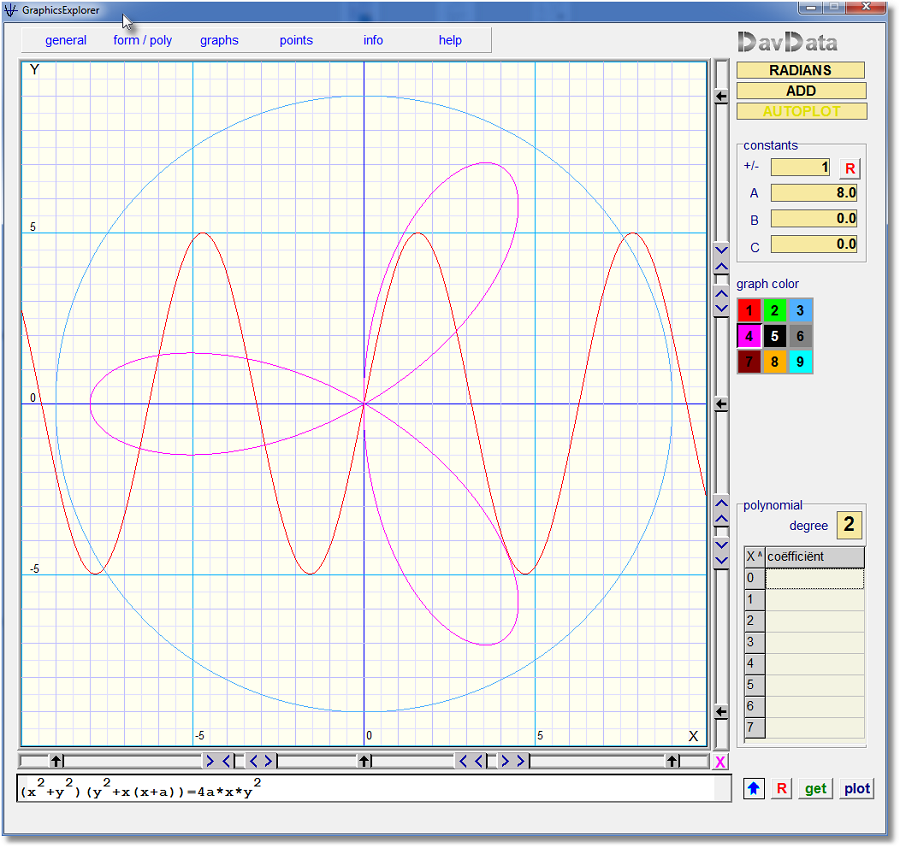
Below a reduced image (version 3.0):
Installation
Graphics Explorer is written for Windows.Click on the download (lightning) icon at the top of this page to download graphxl.exe
There is no installation procedure.
Just copy the .exe file to a folder of choice.
The program contains in-line help.
Features
-
- coordinate system 800 * 800 pixels
- reflections
- integration
- differentiation
- sum, difference, product
- crosshairs with (x,y) indication
- 9 different formulas or polynomials
- scrolling and zooming with mouseclick, x/y independent
- add or delete dots with mouseclick or by table editing
- calculate polynomial degree 0..7 through set of dots
- calculate exponential function through set of dots
- calculate circle through 3 dots
- recognizes 4 types of functions/equations:
| type | example | description | |
|---|---|---|---|
| 1 | y = f(x) | y = 3cos(5x) | function |
| 2 | x = f(y) | x = (y-1)^2 | inverse |
| 3 | y = f(v) ; x = g(v) | y = 5sin(2v) ; x = 7cos(3v) | parametric |
| 4 | f(x) = g(x) | (x2+y2)(y2+x(x+10))=40x*y2 | implicit |
- enter polynomials, degree 0..7, in "coefficient" table
- operations on polynomials:
- a,b,c changable by mouseclick, graphics adjust automatically
- plot function (type 1) 1..3 times differentiated
-
by simply preceding it by d:, dd: or ddd: .
example: y = d:sin(2x)
-
by simply preceding it by i: .
example: y = i: 5sin(x)
- exponential functions through set of dots:
| y = a.bx | y = a.bx + c | |
| y = a.ebx | y = a.ebx + c | |
| y = eax^2 + bx + c | ||
- add personal heading to plots and prints.
- save / reload formulas together with color and settings
- copy graphic image to clipboard
- save graphic image in .bmp file
- mouse- or keyboard operation
- in line help documentation

